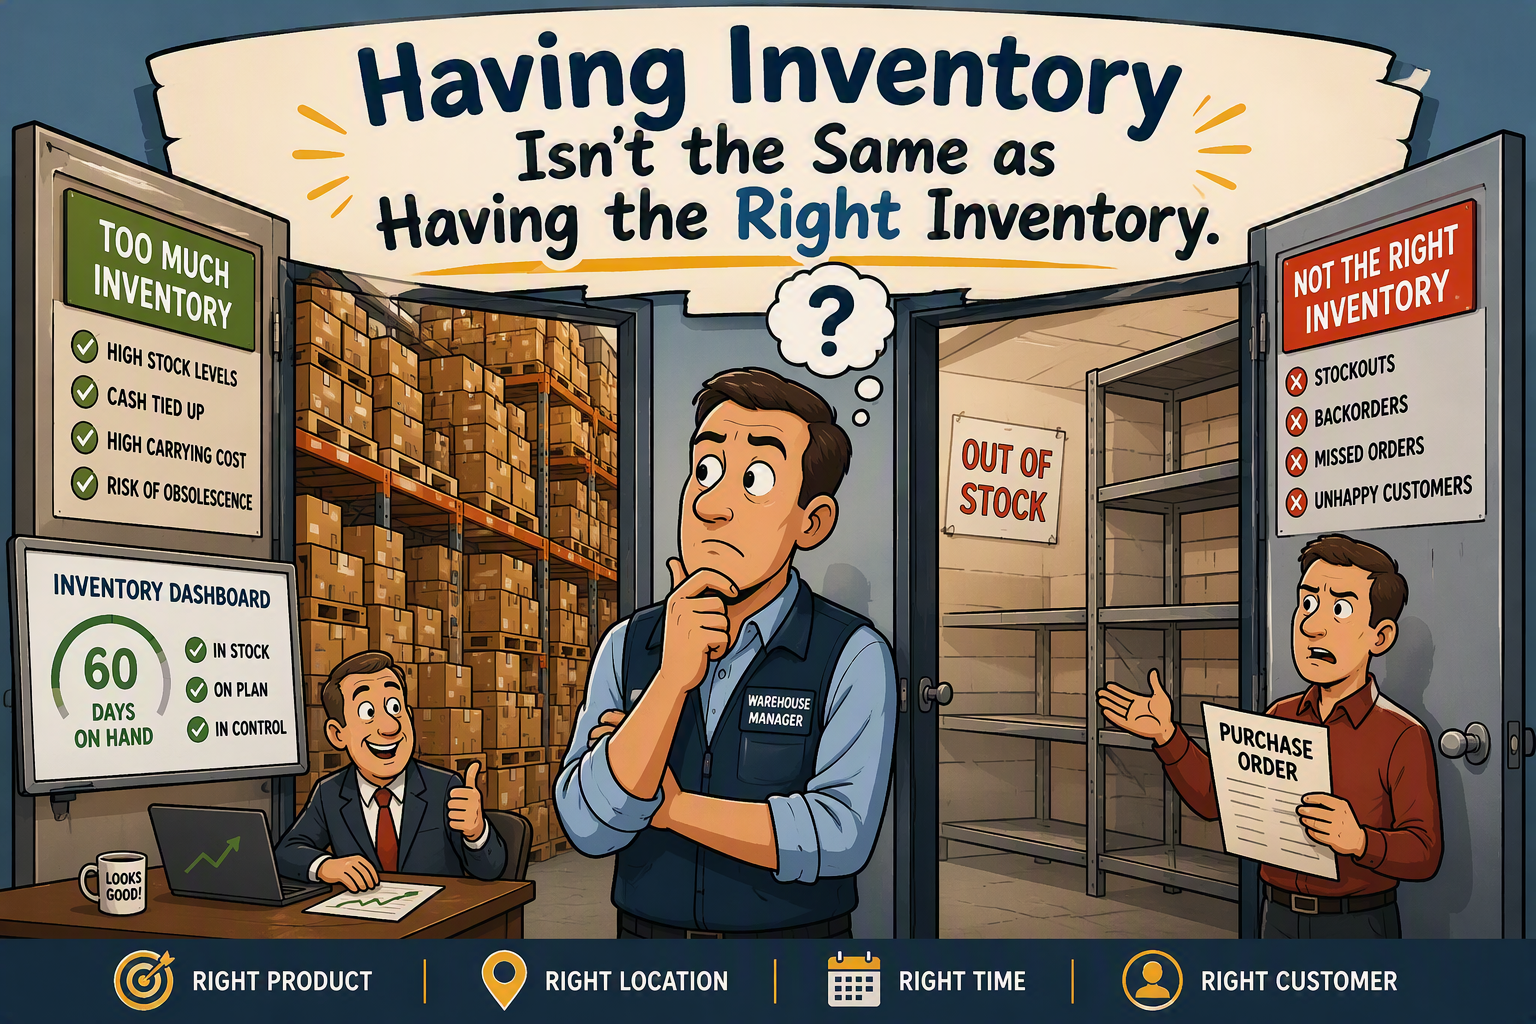
The inventory dashboard shows 60 days on hand. The number is green.
Then sales reports that an important item is on backorder. Customer service says On-Time In-Full (OTIF) performance is slipping. One warehouse wants an emergency transfer from another. Finance points out that total inventory is still climbing.
How can a company have plenty of inventory and still be unable to fill orders?
The answer is simple: it has inventory, but not necessarily the inventory that matters.
Customers do not order average inventory. They order specific products, in specific quantities, from specific locations, on specific dates.
The problem is easy to see. Solving it across thousands of products, several locations, uncertain demand, and changing supply is much harder.
A useful metric with a blind spot
Days of inventory shows how much the company is carrying relative to expected demand and can reveal broad changes in working capital.
But it is still an average.
A company reporting 60 days of inventory might have four months of supply for slow-moving items and less than two weeks for its fastest sellers. It might have excess in one warehouse and a shortage in another. A manufacturer might have plenty of material overall but lack the one component needed to complete an order.
Timing creates another blind spot. Inventory may be on the way but scheduled to arrive after the customer needs it. In total, supply appears sufficient. In the period that matters, it is late.
The green number is not wrong. It is simply answering a broader question than the one the customer is asking.
The inventory position that actually matters
Consider a hypothetical industrial distributor with warehouses in Houston, Dallas, and San Antonio.
Across the company, inventory appears healthy. Yet a high-volume valve is projected to run 400 units short in Houston during the third week of the plan. Dallas appears to have 900 units beyond its expected needs over the next eight weeks. A purchase order for 600 units will replenish Houston in week five—two weeks after the shortage begins.
The obvious answer is to transfer 500 units from Dallas to Houston. But a large Dallas customer project is due in week six. Can Dallas release the inventory safely? Which Houston orders are at risk? What will the transfer cost? Would redirecting the inbound purchase order avoid handling the product twice?
“Houston will run out” is an observation. Deciding how the network should respond is the planning problem.
Manufacturers face the same mismatch. The constraint may be a component, production stage, product configuration, or finished good. Total inventory can look adequate while one missing element prevents an order from shipping.
Why shortages and excess appear together
Stockouts and excess inventory look like opposite problems. Often, they are two outcomes of the same mismatch between demand and supply.
Demand does not change evenly. A forecast can be accurate in total but wrong by product or warehouse. Projects move, purchase orders slip, and production priorities change.
Teams may also work from different views: sales updates its forecast, purchasing reacts to lead times, warehouses respond to local shortages, and finance watches total inventory. Each decision can make sense while the combined plan remains out of balance.
That is how a business ends up with:
- Too little inventory where demand is strongest
- Too much inventory where demand has slowed
- Backorders and missed delivery commitments
- Cash tied up in excess stock
- Transfers and premium freight used to recover service
Adding inventory everywhere may reduce some shortages, but it raises carrying cost and may leave the location problem untouched. Cutting inventory broadly may release cash while making important shortages worse.
The goal is not simply more inventory or less inventory. It is a better match between demand and supply by item, location, and time.
The cost of a poor inventory plan
When that match breaks down, the cost usually appears in three places.
Lost sales and service risk
If an item is unavailable, the company may lose the sale, accept a backorder, substitute another product, split the shipment, or miss the delivery date. Even a recovered order can hurt OTIF performance and customer confidence.
The important measure is not merely the number of stockouts. It is the demand, revenue, margin, and customer commitments exposed by them.
Inventory carrying cost
Excess inventory consumes cash and creates ongoing costs such as capital, storage, insurance, handling, damage, shrinkage, and obsolescence.
Many companies know their monthly carrying-cost rate. Fewer connect it to projected excess by product and location, allowing excess to hide inside an acceptable companywide average.
Redistribution and recovery cost
When inventory is in the wrong place, the business pays to transfer it, handle it again, redirect it, or use a more expensive service.
Some transfers are sensible. The warning sign is repeated, reactive movement that adds cost and workload without adding value for the customer.
These costs should be evaluated together. A transfer may protect an important order. An expedite may cost more than the margin it preserves. A decision that improves service today may create a larger shortage next month.
Planning makes those tradeoffs visible while the business still has choices.
The fix begins with a forward-looking inventory position
The basic calculation is intuitive:
The hard part is applying it consistently across every relevant product, location, and future period—and updating it as conditions change.
A practical solution has five parts.
1. Bring the required inputs together
Combine inventory, customer orders, forecast demand, open supply orders, expected receipt dates, lead times, and planning rules.
The information often already exists in ERP and warehouse systems, forecast files, production plans, and locally maintained spreadsheets. The immediate need is a controlled, reconcilable view of the inputs—not necessarily a major systems project.
2. Project by item, location, and time
Calculate when each position is likely to become short, low, or excessive. Weekly periods are often a practical starting point, depending on lead times and customer requirements.
This turns “inventory is healthy” into more useful statements: “This item is expected to run short in Houston during the week of October 12,” or “Dallas is projected to carry more than three months of supply through the end of the quarter.”
3. Prioritize the exceptions that matter
Most item-location combinations will not require action. Attention should go to exceptions with the greatest service, financial, or operational consequences.
A small shortage affecting a critical customer may deserve more attention than a larger shortage on low-priority demand. Concentrated excess with a high carrying cost may matter more than dozens of minor imbalances.
4. Test the available responses
The business can compare its choices: change supply, transfer inventory, expedite or redirect inbound product, allocate constrained stock, defer receipts, or revise a customer commitment.
Each response must be evaluated across the network and across time. Moving inventory is not a solution if it creates a larger shortage at the supplying location. Deferring a receipt may reduce excess now but create risk later.
5. Recalculate before the answer becomes obsolete
Demand changes, receipts move, and decisions are executed. Refresh the plan often enough to preserve time for action.
The value is not merely identifying a stockout. It is identifying it while several reasonable responses are still available.
Could this be done in spreadsheets?
Yes. A capable planning team with sufficient time, disciplined inputs, and well-designed spreadsheets can build this analysis.
The difficulty is maintaining it as the number of products, locations, data sources, and scenarios grows. Collecting and reconciling the information can consume the time planners need to evaluate decisions.
Purpose-built tools can make the same planning logic faster, more repeatable, and easier to explain. The Vega Planning Platform is designed to project inventory by item and location, surface shortage and excess exceptions, evaluate responses such as transfers or inbound changes, and show the assumptions behind the result.
Vega does not eliminate the tradeoff or make judgment unnecessary. It helps planners and leaders see the tradeoff earlier and evaluate it with a consistent view of demand, supply, service, and cost.
Ask the question the customer is asking
“How many days of inventory do we have?” remains a useful question.
It just should not be the last one.
The next questions are more specific:
- Which products will become short or excessive?
- Where will the imbalance occur?
- When will it affect an order or operation?
- Which customers and commitments are exposed?
- What will it cost if nothing changes?
- Which response improves the total position rather than moving the problem?
A company can carry 60 days of inventory and still miss customer demand. The answer is not automatically to buy more or cut more. It is to understand what will be needed, where it will be needed, and when—and to act while the business still has good choices.