
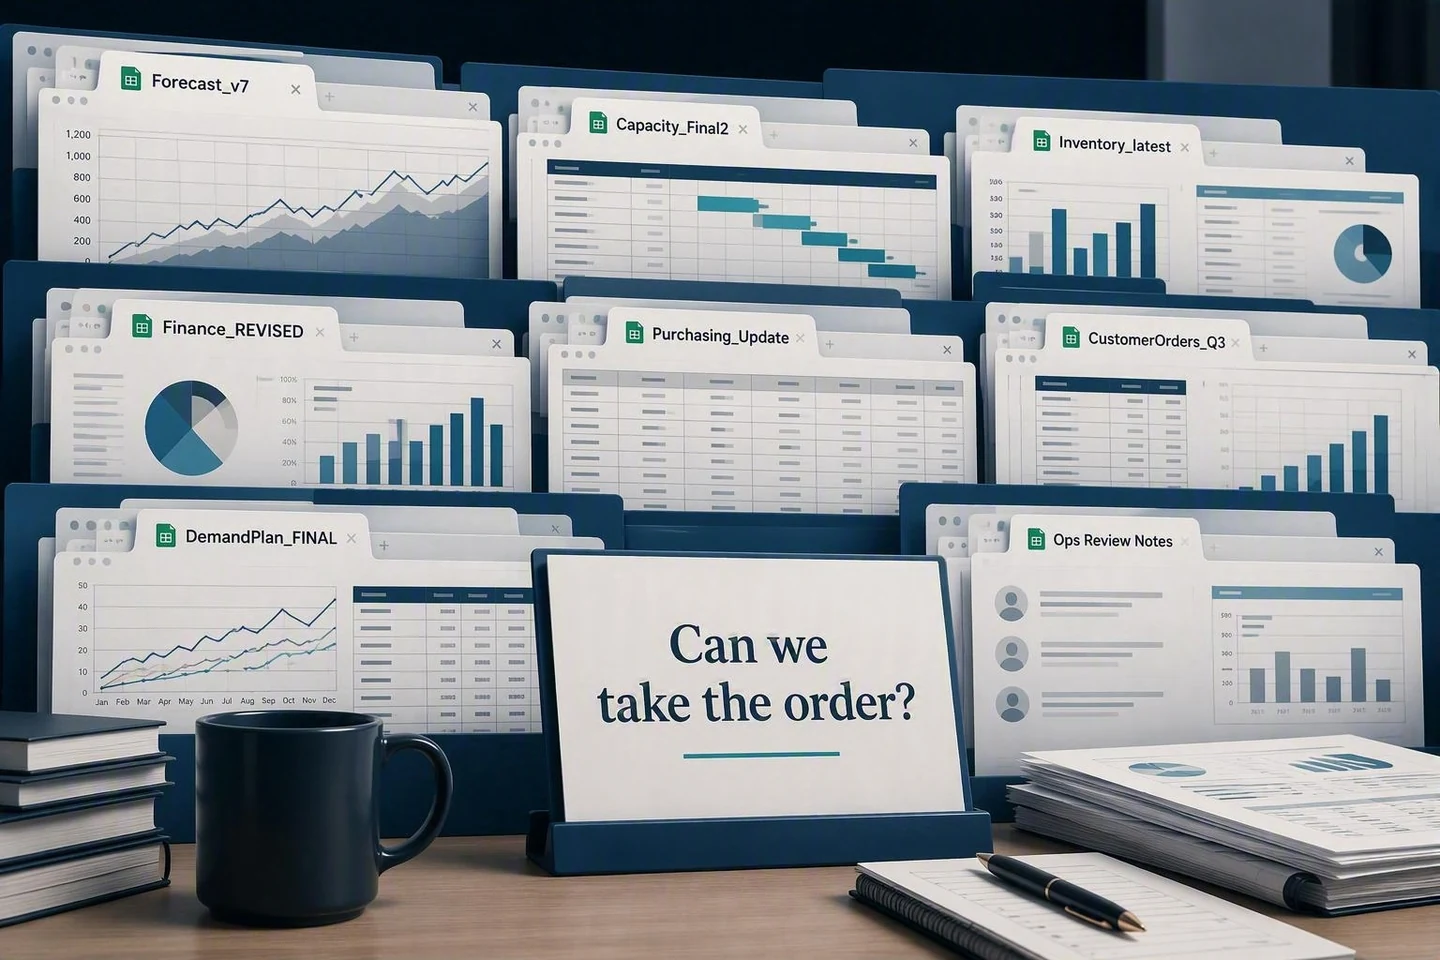
Most companies already have the data they need.
Demand is in one spreadsheet. Inventory is in another. Capacity lives somewhere else. Purchasing, customer orders, forecasts, and financial assumptions may all have their own files, reports, or systems.
The problem is usually not that the data does not exist.
The problem is that the information is trapped inside disconnected systems, reports, and spreadsheets.
That makes it harder to see the business as a whole.
A planner may understand inventory. Sales may understand the forecast. Operations may understand capacity. Purchasing may understand supplier constraints. Finance may understand the financial impact.
But answering a simple business question can still require several people, several files, and several rounds of reconciliation.
What happens if demand increases?
Which customers are most exposed to a shortage?
Do we have enough capacity to support the forecast?
Why did inventory increase?
What should we do first?
The answers may already exist somewhere in the data. The difficulty is bringing the information together quickly enough to make a decision.
The spreadsheets usually exist for a reason.
Spreadsheets are easy to blame, but in most organizations they did not appear by accident.
The ERP was built primarily to execute transactions.
Sales needed a better way to manage the forecast.
Operations needed a capacity plan.
Purchasing needed visibility into upcoming requirements.
Finance needed a financial forecast.
Each team built the view it needed to do its job.
Individually, those tools may work perfectly well.
The problem appears when the business needs to make a decision that crosses them.
A change in demand does not affect only the forecast. It may affect inventory, purchasing, production, capacity, customer service, cash, and margin.
If those functions are planning from separate views of the business, understanding that impact takes time.
And sometimes the issue is not that anyone has the wrong number.
It is that everyone has a different piece of the answer.
The problem appears between the files.
Consider a relatively simple example.
Sales increases the forecast for a major customer.
The demand planner sees the increase immediately.
Purchasing may still be working from the previous requirement. Operations has enough capacity this month but may be constrained next month. Inventory looks sufficient in total, but some of the material is not the material needed for the new demand. Finance can see inventory and working capital increasing but may not know which assumptions are driving the change.
Every individual report may be correct.
Yet the organization still has to determine:
- whether the customer can be supported;
- which materials will become constrained;
- whether additional purchasing is required;
- whether capacity needs to move;
- what happens to inventory and working capital;
- and whether the additional demand is financially attractive.
That is not fundamentally a spreadsheet problem.
It is a planning visibility problem.
The information exists, but the relationships between the information are difficult to see.
Visibility is the first step—not the finish line.
Bringing planning information into a common environment creates something many organizations do not have today: a shared view of the business.
Instead of searching across files, leaders can see demand, inventory, capacity, purchasing, customer requirements, and financial information together.
That alone can eliminate a significant amount of manual reconciliation.
But putting information on one screen is not the end goal.
The real value comes from being able to understand:
What changed?
What matters?
Where are the risks and opportunities?
What happens next if nothing changes?
What options do we have?
What are the operational and financial consequences of those options?
That is the difference between simply reporting data and using data to support planning decisions.
The goal is not to eliminate spreadsheets.
Spreadsheets remain useful tools.
They are flexible, familiar, and often the fastest way for a team to model something new.
The goal should not be to replace every spreadsheet in the organization.
The goal is to stop making the business depend on people manually stitching information together every time an important question needs to be answered.
A better planning environment can still accept information from spreadsheets, ERP systems, CRM platforms, financial systems, production reports, and other existing sources.
What changes is what happens next.
The information is reconciled.
Related data is connected.
Exceptions become easier to identify.
Operational and financial tradeoffs become easier to evaluate.
And leaders can work from a shared picture of the business rather than trying to assemble one during the meeting.
Better visibility creates better decisions.
Most companies do not need another source of data.
They need a better way to use the data they already have.
That starts with connecting information that is currently separated by functions, systems, reports, and spreadsheets.
Once that information is connected, the conversation changes. Instead of debating which number is right, teams can focus on three more useful questions:
- What does the number mean?
- What is changing?
- What should we do about it?
The goal is not to get rid of spreadsheets.
It is to stop making the business depend on people manually stitching them together every time a decision needs to be made.
When the information is connected, leaders can spend less time assembling the picture—and more time deciding what to do about it.